Market Overview

Description
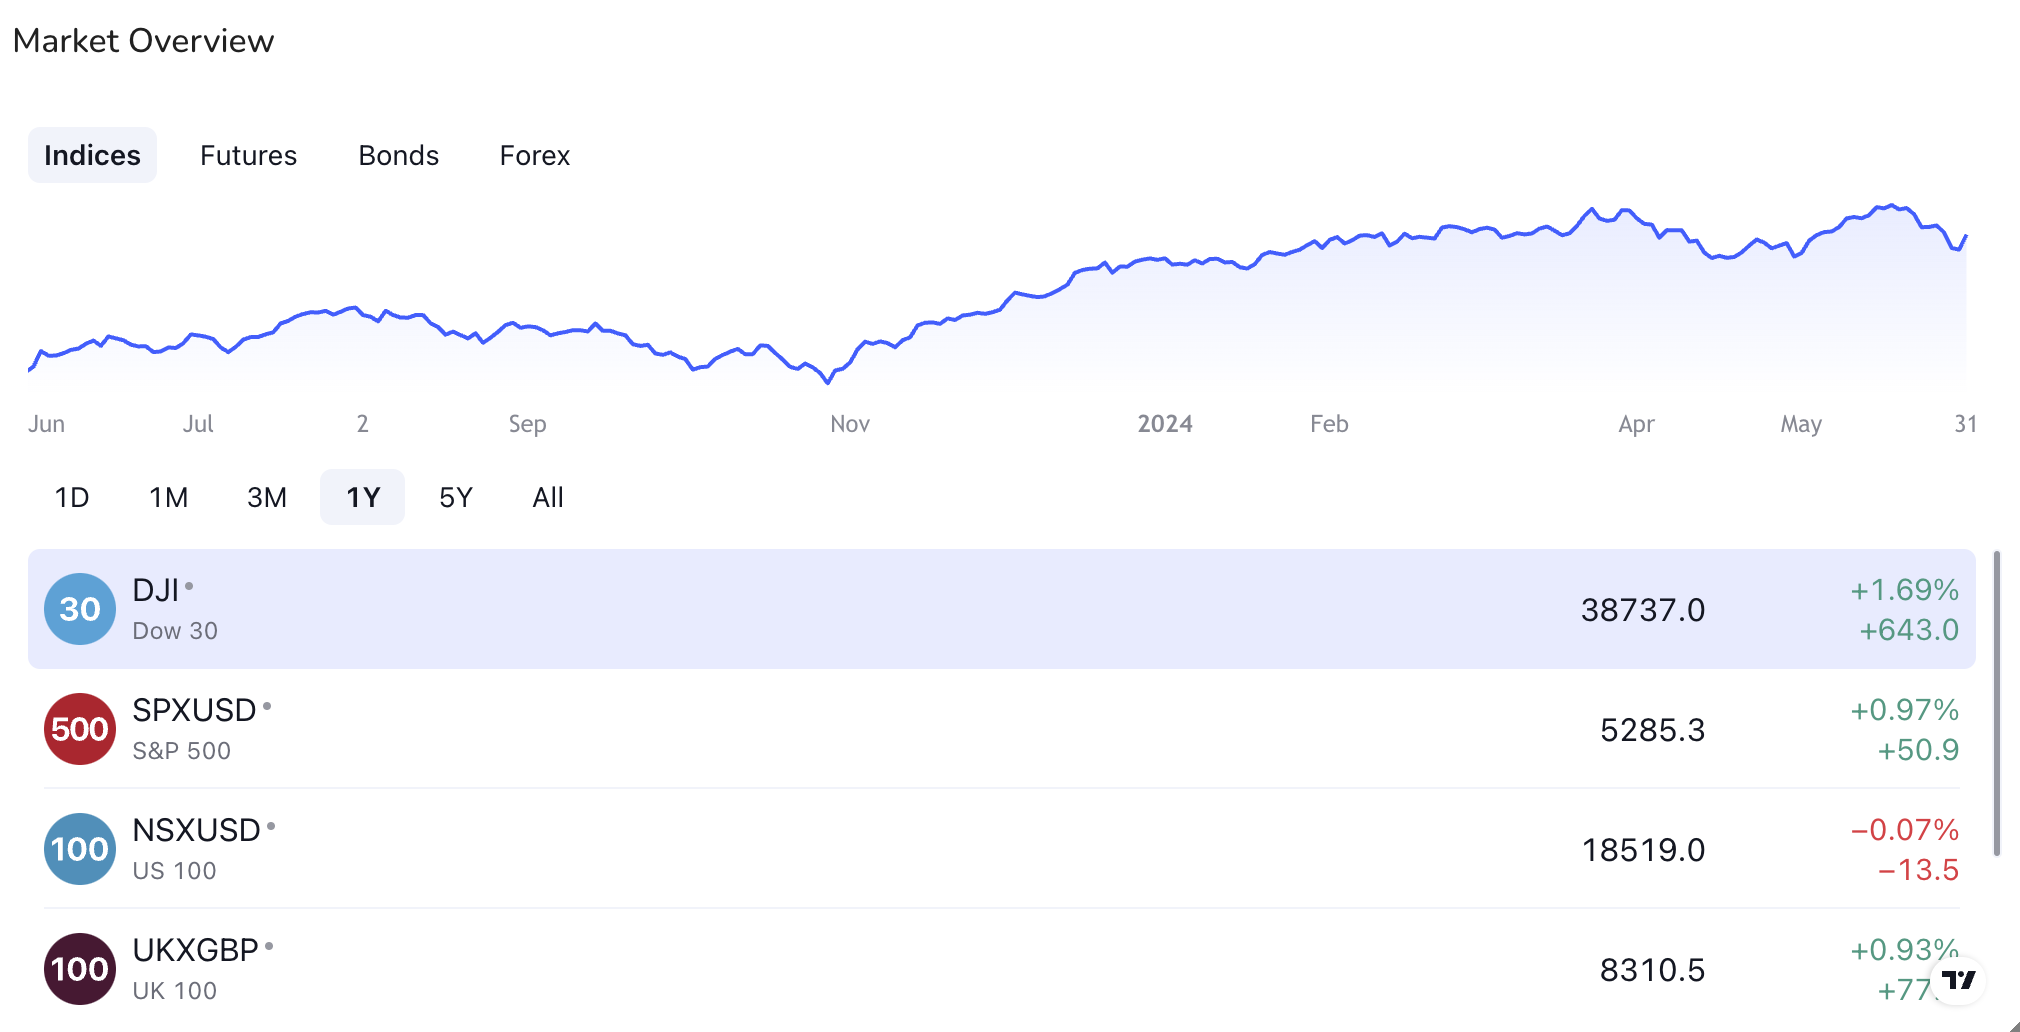
The Market Overview widget provides a comprehensive snapshot of various market segments including indices, futures, bonds, and forex. It allows users to monitor market performance over different time periods, giving a clear visualization of trends and movements.
Features
- Market Segments: Users can switch between different market segments: Indices, Futures, Bonds, and Forex.
- Timeframes: The widget supports multiple timeframes for analysis, including 1D (1 Day), 1M (1 Month), 3M (3 Months), 1Y (1 Year), 5Y (5 Years), and All (entire available historical data).
- Performance Indicators: Displays key performance metrics for selected indices, currencies, or other market instruments over the chosen timeframe.
- Interactive Chart: A line chart that dynamically updates based on the selected market segment and timeframe.
Data Display
- Indices: Shows performance data for major indices such as Dow 30, S&P 500, US 100, and UK 100.
- Forex: Displays currency exchange rates and their percentage change for pairs like EUR/USD, GBP/USD, USD/CHF, AUD/USD, and USD/CAD.
User Interaction
- Segment Selection: Users can click on the tabs (Indices, Futures, Bonds, Forex) to switch between different market segments.
- Timeframe Selection: Buttons below the chart allow users to change the timeframe for the data displayed
Holdings Overview Widget
Description
The Holdings Overview widget provides a visual representation of your portfolio's composition. It allows you to see the allocation of your holdings by different categories such as Type, Broker, or Portfolio. The widget can display this data in various formats, including bar charts and pie charts, and can show both percentage and value allocations.
Features
- Allocation By: The widget allows you to choose how the holdings are allocated. Options include Holding Type, Broker, and Portfolio.
- Value At: You can select to view the holdings based on Market value or Cost value.
- Data Display: Users can choose to display the data